
[GA4] Calculated Metric – Scroll Rate
By enabling the enhanced event measurement feature in GA4, you can measure the number of page scrolls on a website. This event is measured when a user scrolls down to the bottom of each page for the first time (displaying up to 90% vertically).
In this post, we’ll explain how to use GA4’s calculated metrics to report the percentage of users who scrolled to 30%, 60%, and 90% of the depth on each page.
Measuring Scroll Events
By enabling the extended event measurement feature in GA4’s admin panel, you can automatically measure the number of scroll completions (up to 90% depth in the vertical direction) on your website. However, in this case, we will use Google Tag Manager (GTM) to measure scroll counts at 30%, 60%, and 90% vertical scroll points on each page. For more details on scroll measurement with GTM, please refer to this link.
Reference to our JP post: How to Measure GA4 Scroll Tracking with GTM
To calculate the scroll rate, custom metric measurement and configuration are required. Custom metrics are numerical values with specified measurement units (such as currency, distance, or time) that can be used in calculated metrics. For this purpose, we will set them as standard numerical values.
The measurement setup in GTM will be as follows. Specifically, we will set Value=1 for each event parameter.
Event Parameters (Custom Metrics):
- percent_scrolled_30: Value 1 when scrolled 30%
- percent_scrolled_60: Value 1 when scrolled 60%
- percent_scrolled_90: Value 1 when scrolled 90%
The difference from custom dimensions is that for custom metrics, you need to prepare the respective event parameter names. The Value remains fixed at 1.
Tag Name: Tags – ga4 – scroll_custom
 ・Tag Type:Google Analytics GA4 Event
 ・Event Name:scroll_custom
 ・Event Parameters:percent_scrolled_{{Scroll Depth Thresholed}}
 ・Event Value:1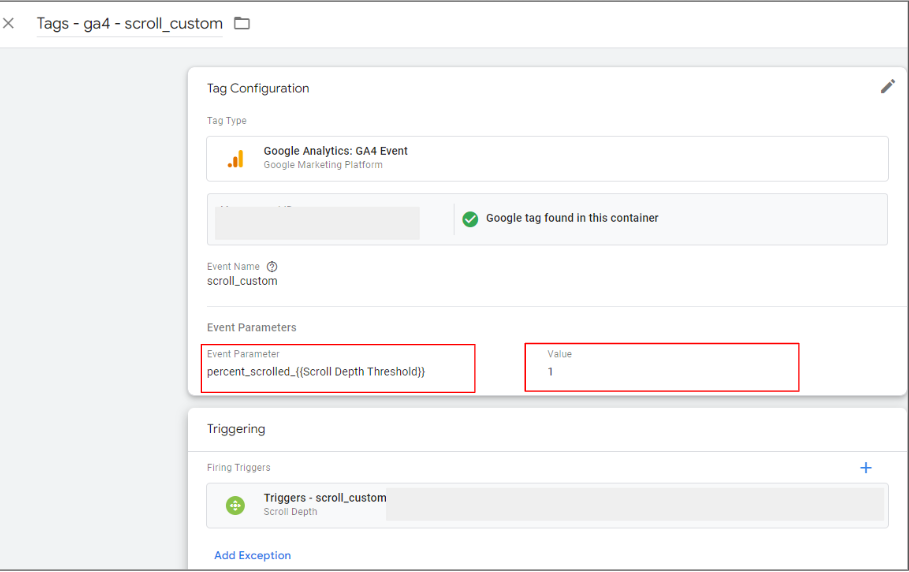
Trigger Name: Triggers – scroll_custom
 ・Trigger Type:Scroll Depth
 ・Vertical Scroll Depths:30,60,90 percent
 ・This trigger fires on:Page Path (含む) /column/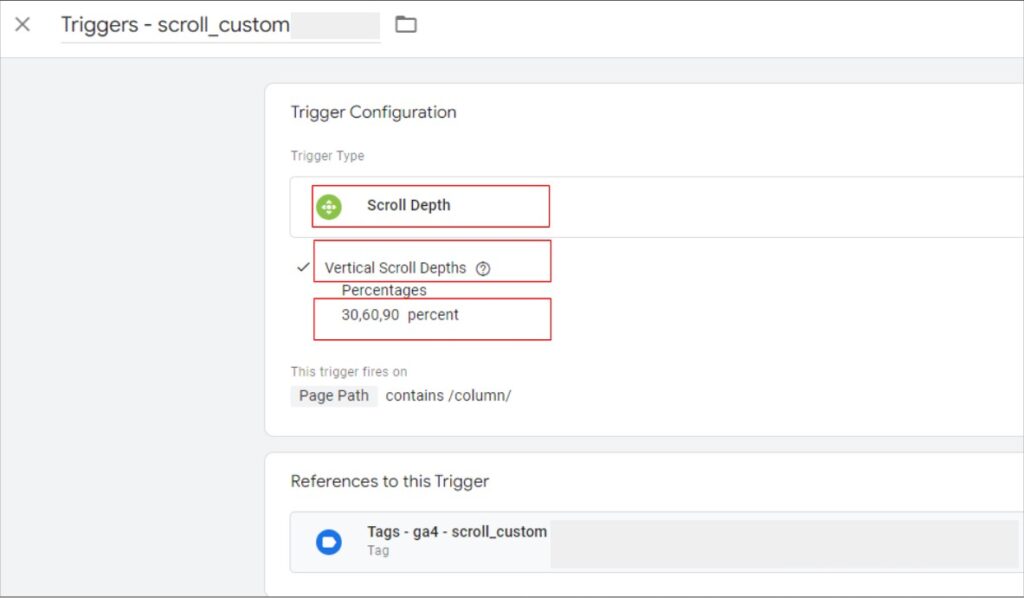
The event parameter name of the tag is set as percent_scrolled_{{Scroll Depth Threshold}}, where the part {{Scroll Depth Threshold}} dynamically takes values (strings) such as 30, 60, 90.
Specifically, the following events and event parameters are measured. Example: in the case of percent_scrolled_30.
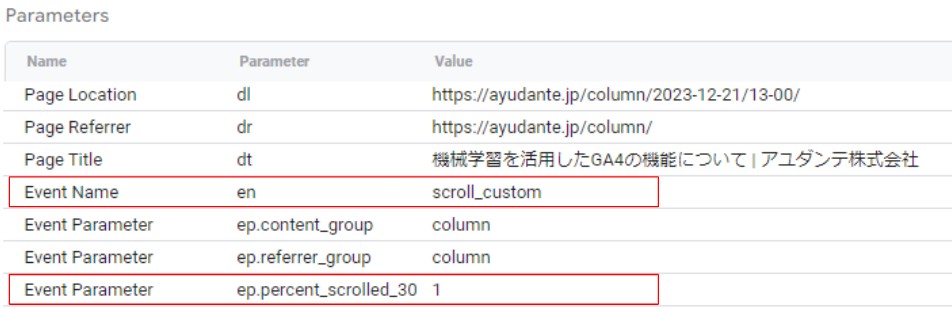
Example: In the case of percent_scrolled_30.
Setting up Custom Metrics
Using GTM, we measured the scroll counts on pages under /column/. To utilize the scroll counts at 30%, 60%, and 90% on each page as Custom Metrics, we will configure Custom Metrics from the GA4 admin panel.
Select “GA4 Admin Panel > Data Streams > Custom Definitions” from the menu, then choose “Custom Metrics” from the top menu of the custom definitions table.
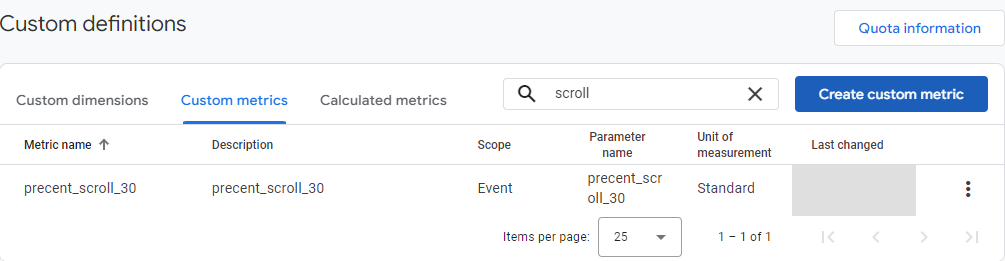
Click the blue button labeled “Create Custom Metric” at the top right to create a new custom metric. Create three custom metrics: percent_scrolled_30, percent_scrolled_60, and percent_scrolled_90.
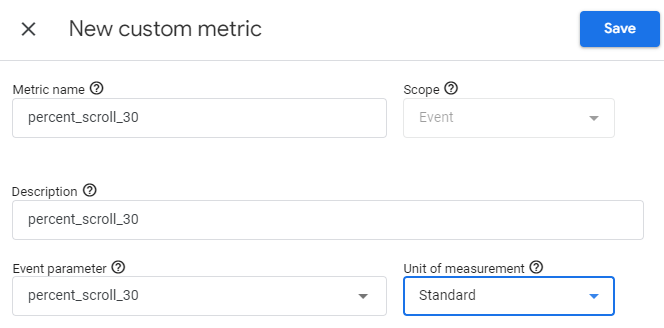
Creating Custom Metrics.
Setting up Calculated Metrics
Once the custom metrics are set up, we will create calculated metrics using the created metrics.
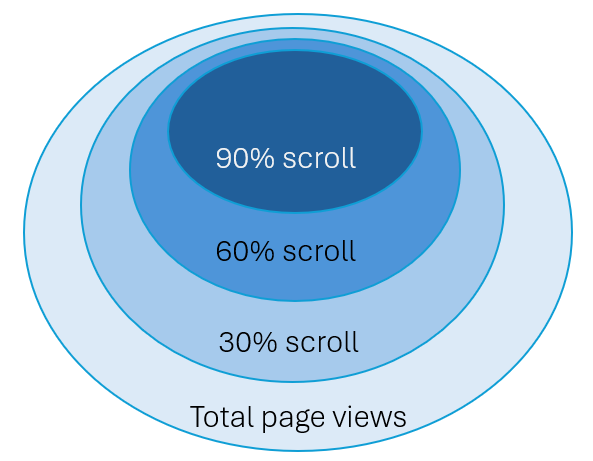
First, we determine which part of the measurements corresponds to which section and clarify the type of report we want to generate. Note that if a user scrolls to 90%, it is also counted in the 60% and 30% categories.
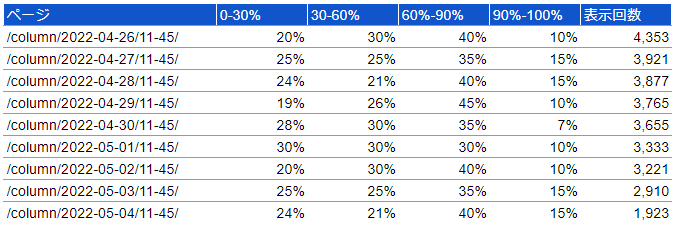
In this case, our goal is to analyze the distribution of scroll percentages per page, so we aim to calculate the percentage breakdown for each scroll depth. The output of the report will resemble the following:
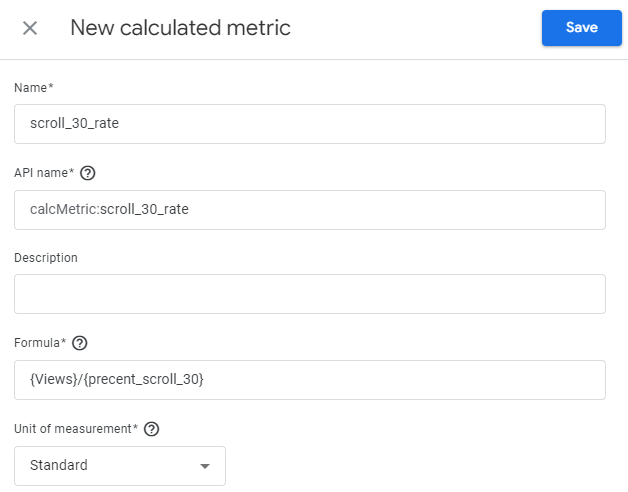
The calculation formulas for the metrics are as follows. Let’s register these formulas in the GA4 admin panel:
- Percentage of visitors who did not scroll 30% of the page: ({Impressions} – {percent_scrolled_30}) / {Impressions}
- Percentage of visitors who scrolled from 30% to 60%: ({percent_scrolled_30} – {percent_scrolled_60}) / {Impressions}
- Percentage of visitors who scrolled from 60% to 90%: ({percent_scrolled_60} – {percent_scrolled_90}) / {Impressions}
- Percentage of visitors who scrolled 90% or more: {percent_scrolled_90} / {Impressions}
Formulas can include basic arithmetic operations and parentheses. In addition to custom parameters, pre-aggregated metrics such as impressions, sessions, and active users can also be used. However, advanced functions such as median, exponentiation, and logarithm are not available. Select “Standard” as the unit of measurement and proceed with registration.
Conclusion
Calculated metrics can be used once they are set up. Note that they are not retroactively applied to past data. If you want to report metrics like CVR or CTR, you need to incorporate them into your measurement design requirements beforehand.
Remember that custom dimensions are for strings, while custom metrics are for numbers (with units). Managing them this way can make administration easier. By simultaneously checking volume (event counts or user numbers) and efficiency (ratios), you can increase the information obtained from analysis. There are limitations on the number of custom metrics and calculated metrics that can be created per property (up to 5 for standard properties and up to 50 for 360 properties), so careful planning is necessary, similar to custom dimensions.
As of the end of 2023, calculated metrics in GA4 are still in beta version.