
[GA4] How to understand the ecommerce performance on Google Analytics 4
In my last article, I explained the flow of how to measure user ecommerce interaction with DataLayer. This time, I will use the GA4 demo account as an example to explain the important KPIs to review. and how a well-implemented DataLayer can assist you in finding insights from users’ behaviour.
To access the GA4 demo account, you must either link your company email address with Google or create a Google account (click here for the step-by-step instructions).
After creating your Google account, please visit this link to access the demo GA4 property. Agree to the required terms and conditions, and
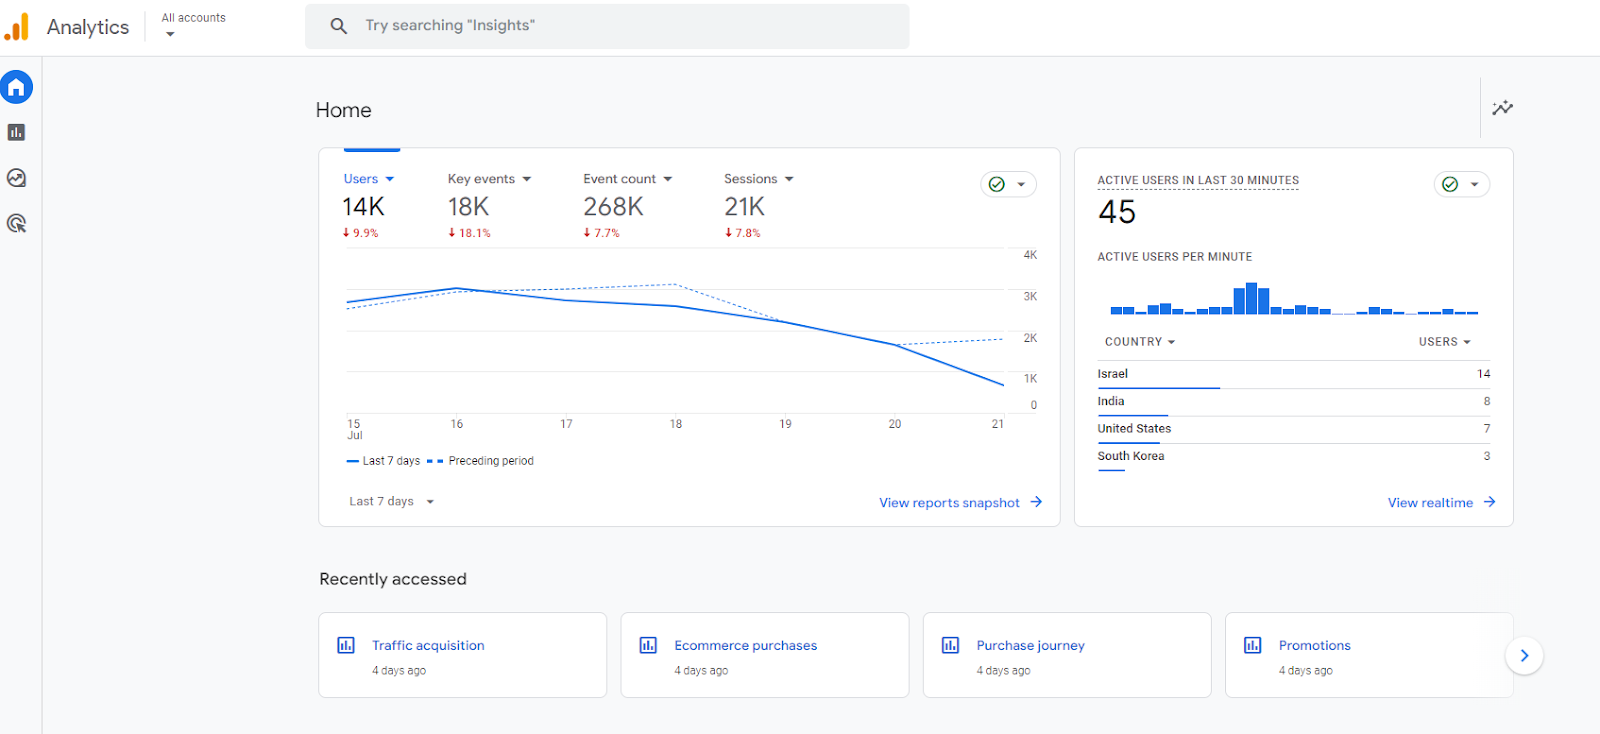
Congratulations! you will be able to see this interface.
Before that, please double-check if you are using an e-commerce platform like Shopify or BigCommerce, which may automatically generate some e-commerce-related events with transaction details, you might see this report automatically.
However, if your website has been built from scratch and does not rely on an e-commerce platform, you will need to implement a well-structured data layer to collect transaction information. (For instructions on data layer implementation, please visit here to review my previous article.)
Please bear in mind that data and components do not simply appear on their own. Proper configuration is essential; it won't happen by magic.
There are numerous reports visible on Google Analytics, but not all of them are equally useful. In the Google Analytics 4 report, you’ll encounter a vast amount of data and figures. However, which reports should you truly focus on?
1. Ecommerce Purchases Report
Monetization > Ecommerce purchases
This report helps you understand the overall e-commerce performance of your website.
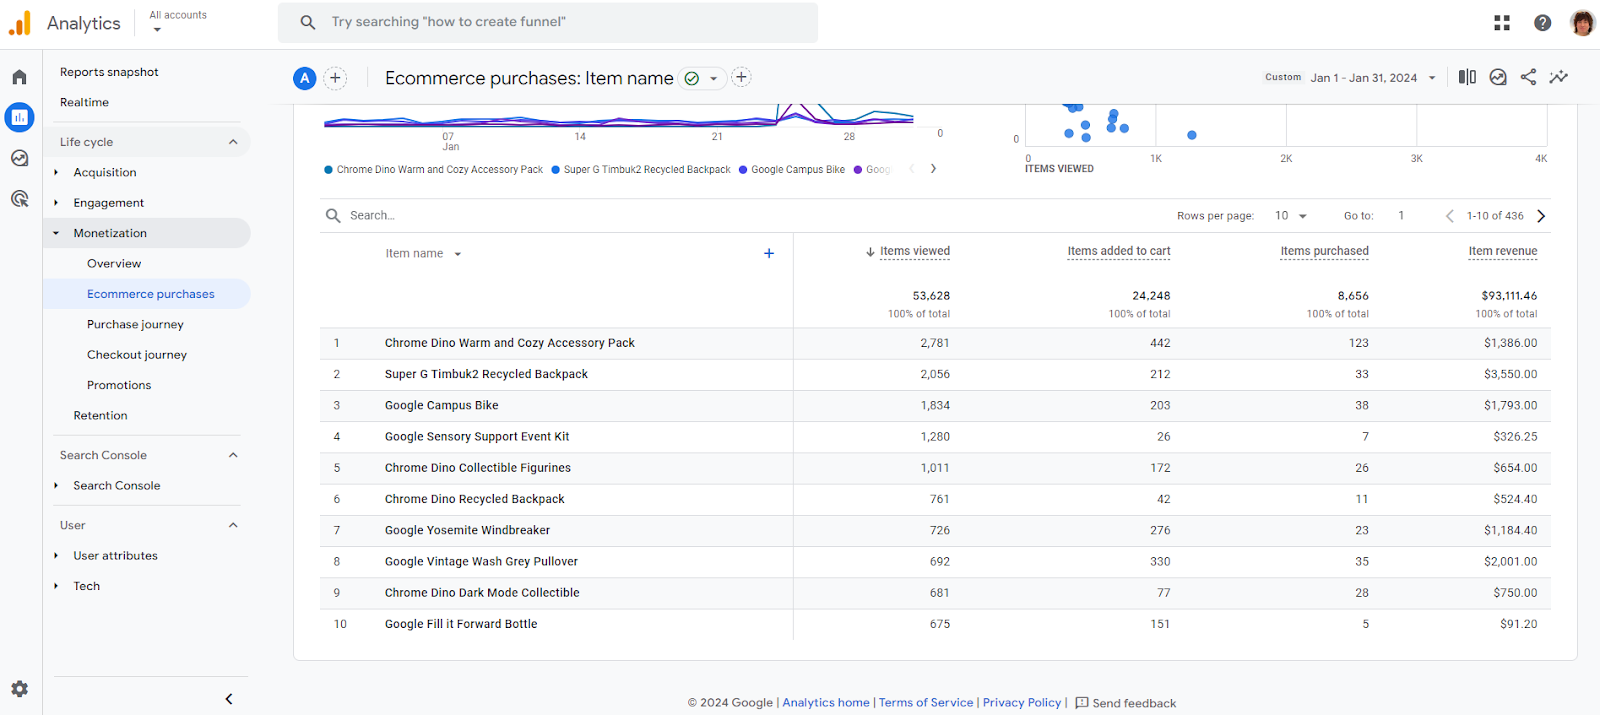
By this report, we would be able to see:
- Items Viewed: This refers to the number of times that item has been viewed.
- Items Added to Cart: This refers to the number of times that item has been added to the cart.
- Items Purchase: This refers to the number of times the item has been purchased.
- Item Revenue: This refers to the gross amount of revenue generated by the item.
For how a data layer can help collect and display those data, please refer to this section of my previous article. Again, because the data layer helped us collect the information like event name, item name, and value, we can understand the ecommerce purchases in this report.
// Clear the previous ecommerce data
window.dataLayer = window.dataLayer || [];
window.dataLayer.push({ ecommerce: null });

// Push add_to_cart event with relevant data
window.dataLayer.push
({ "event": "add_to_cart", "ecommerce": {
  "currency": "USD",
  "value": 28.00,
  "items": [ {
          "item_id": "SKU_12345",
          "item_name": "Google Eco Tee White",
          "affiliation": "Google Merchandise Store",
          "discount": 0,
          "index": 0,
          "item_brand": "Google",
          "item_category": "Apparel",
          "item_category2": "Adult",
          "item_category3": "Shirts",
          "item_category4": "Crew",
          "item_category5": "Short sleeve",
          "item_variant": "SM",
          "location_id": "product_detail_page",
          "price": 28.00,
          "quantity": 1 } ]
} });
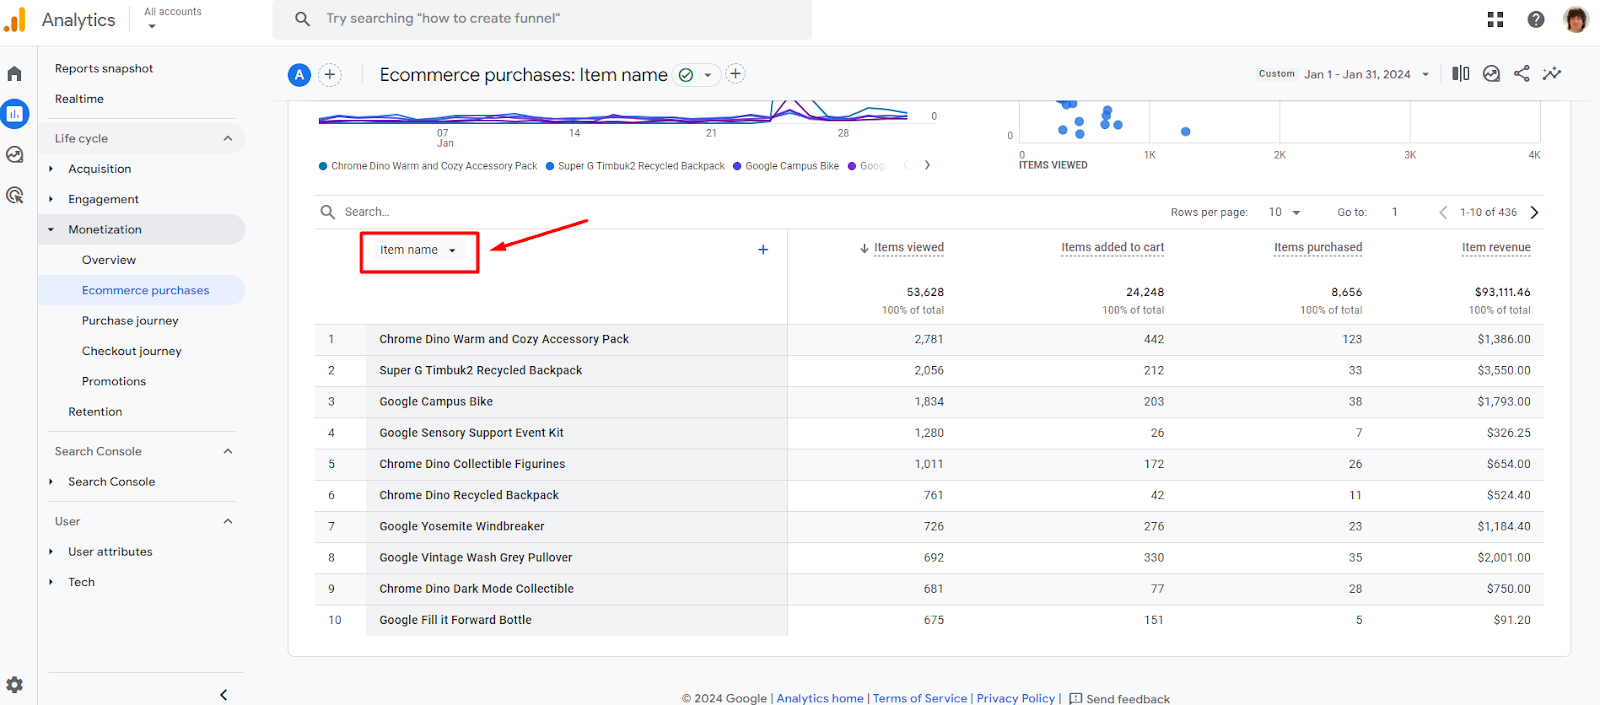
Of course, we can also extract other collected data and analyse the rest, such as item category and item brand. Simply by clicking “Item Name”, you will see a pull-down menu allowing this report to be grouped by:
- Item name (Default)
- Item ID
- Item category
- Item category 2
- Item category 3
- Item category 4
- Item category 5
- Item variant
- Item brand
Normally, if you use ecommerce integrations like Shopify or BigCommerce, most of these selections won’t be available in this report. Please take note of this.
2. Checkout Journey (instead of Purchase Journey)
Monetization > Checkout journey
This report is designed to provide you with a comprehensive understanding of the user checkout funnel, including the types of devices utilised by users during the checkout process. In a default setting, these four steps represent the events of begin_checkout, add_shipping_info, add_payment_info, and purchase.
*You may also click the highlighted URL to review the corresponding datalayer, which can assist you in understanding the information passed to Google Analytics.
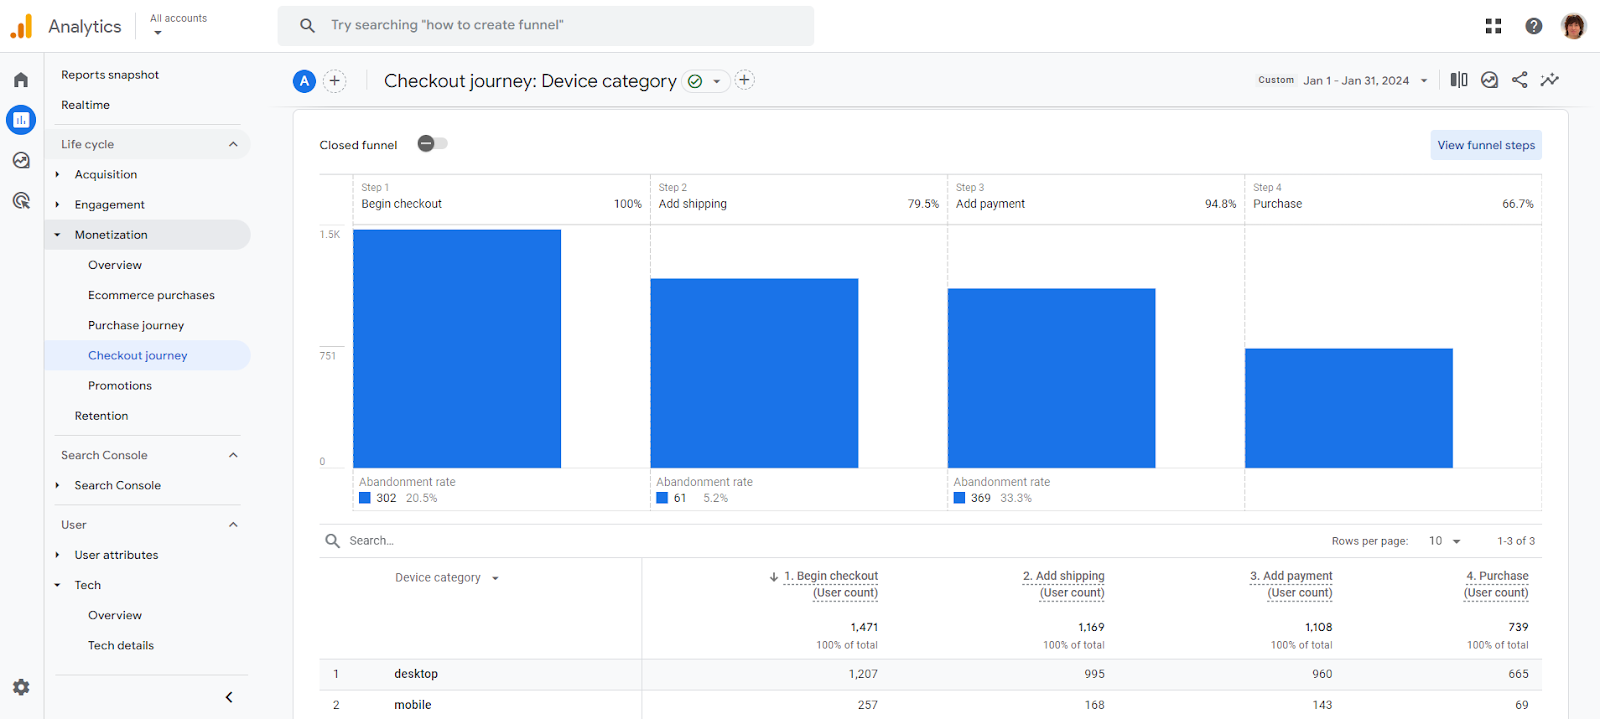
This report will provide insights into three key areas:
- Devices used for checkout:
If more users are checking out on mobile devices, consider designing a mobile-friendly checkout process. Additionally, ensure that your website has a mobile-friendly responsive design to provide a better overall checkout experience for users.
- Steps where most users drop out:
If many users drop out at a particular step, you might offer a coupon discount to encourage them to complete the checkout. Also, if many users drop out between adding payment information and completing the purchase, especially on mobile, consider integrating secure payment options like Apple Pay or Alipay.
- Purchase completion rate by age group:
If a particular age group has a higher completion rate, you might implement a marketing strategy targeting that age group. For instance, if younger users are more likely to finish the checkout process, focus your advertising efforts on that demographic and ensure that your products have higher exposure on SNS or websites to that particular age group.
| You may also see an option to turn on the closed funnel or not. A closed funnel requires users to follow each step in a set sequence, while an open funnel (default setting) shows the number of users entering any step in the funnel; you may think of an open funnel as simply counting events. Based on your purposes for viewing the report, you may choose to turn this section on or off. |
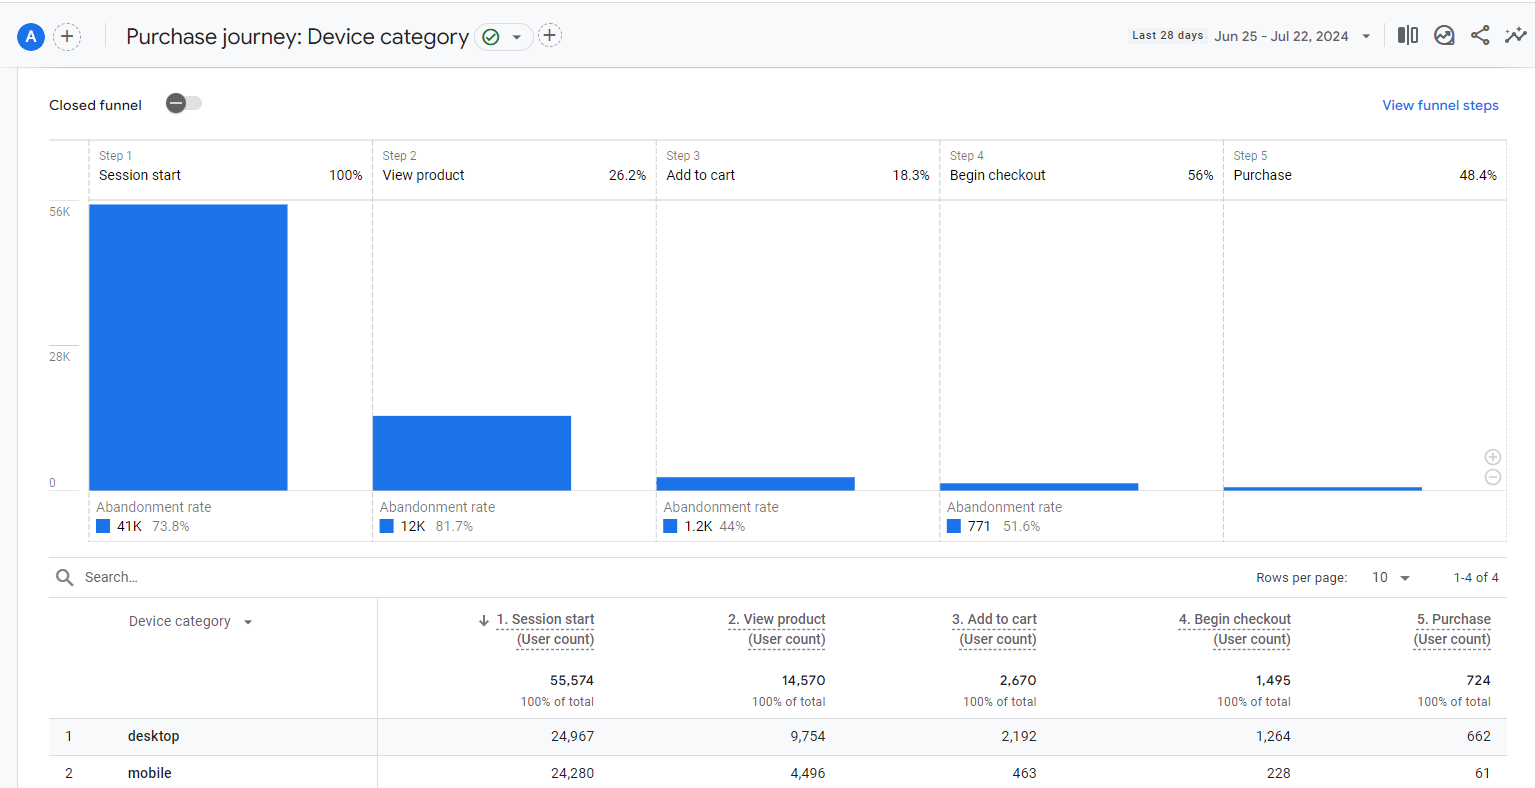
In the end, I would not recommend using the purchase journey for insight findings. In a default setting, five events will be visible in this report: session_start, view_item, add_to_cart, begin_checkout, and purchase.
The reason is that these five steps are not strongly associated with each other, and they do not create a strong funnel within a single checkout journey.
For example, you might view a product first and then add it to your cart after some time. Or, after adding a product to your cart, you might not begin the checkout procedure immediately but instead go back to find another item to check out together.
From viewing this report, you would only see that there is a lot of drop-out between these steps, but this report has a very weak connection to tell you why this happens, and what you should focus on.
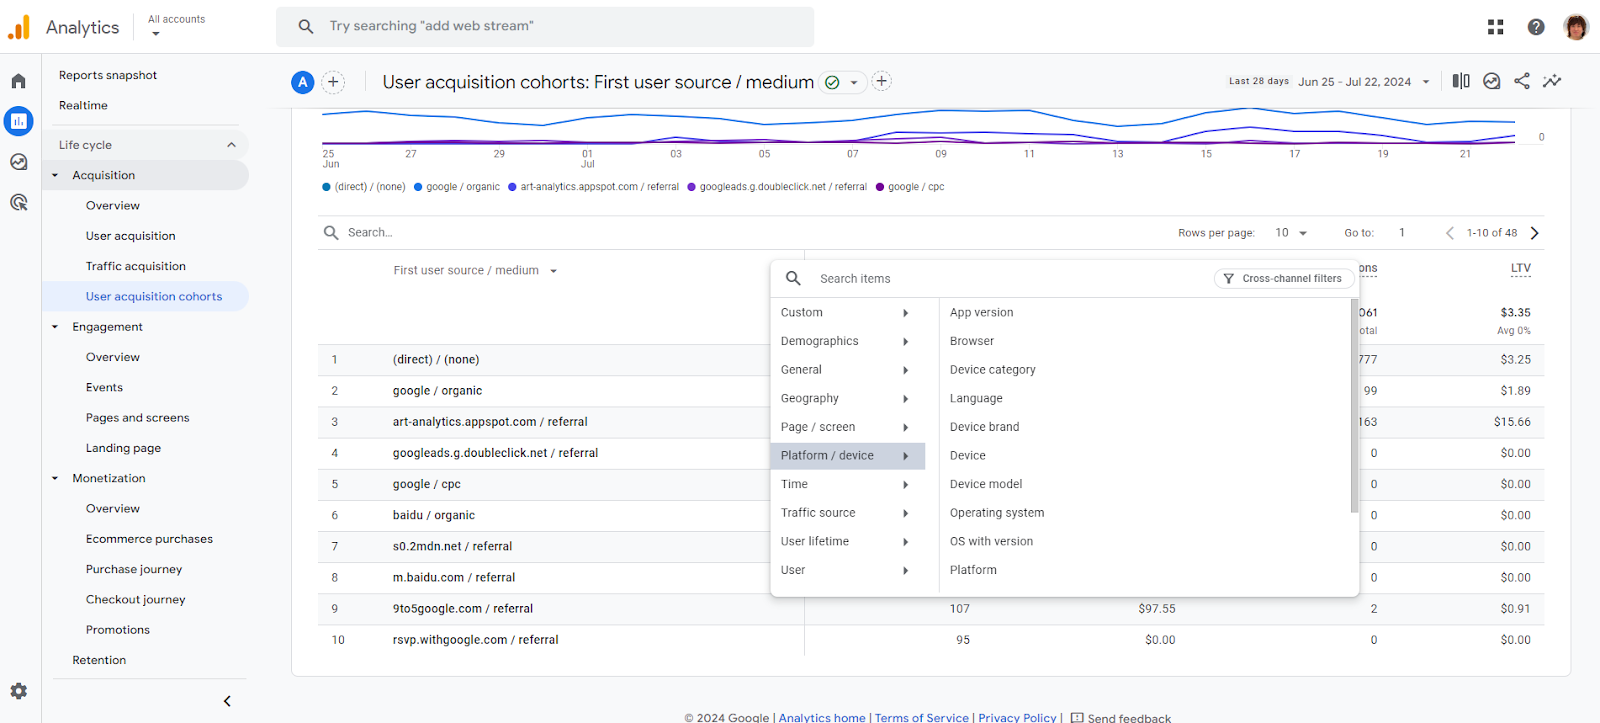
3. User Acquisition Cohorts
Acquisition > User acquisition cohorts
Budget allocation is always a challenge for marketers. This report helps you identify which sources and mediums drive the most transactions on your website, allowing you to allocate your media budget more effectively. You can increase spending on the most successful websites or reduce spending on less effective channels to use your budget wisely.

By simply clicking the “+” icon, you can add a secondary dimension to view the data combination, providing unique insights.
Summary
In modern times, every company uses specific website analytics tools. However, understanding how to read the reports and their purposes can be challenging.
Google Analytics 4 offers a sophisticated reporting model. This time, I have introduced three reports related to ecommerce performance. To view these reports, robust data collection with a data layer is required (you can click here to view my article on data layer implementation).
The data layer not only records user activities but also helps create connections between events, providing more detailed insights into each user activity.
Major ecommerce platforms like Shopify and BigCommerce offer connectors that require data layer-less built-in integration with GA4 and other media platforms. This integration is user-friendly and straightforward, but if an issue arises, you might not be able to fix it yourself. Additionally, it may limit your ability to customise certain user activities in the GA4 report that you value.
It is always recommended to consult your media or analytics partner to manually implement the DataLayer without using ecommerce built-in connectors. This ensures a robust and customised implementation that fits your website. Moreover, if there is an error in the implementation, you will know who to contact for assistance.
Data is never a solution, but without robust and controllable data collection, every business decision is just a groundless assumption. “I think” should never be a business decision.