
[GA4] Finally! Plot Rows in Basic Reports!
Earlier this month GA4 announced a series of new reports enhancements, at least one of which was small, but big news for some. The ability to plot rows!
I have missed this feature, perhaps a little too much. Now that it’s here, it’s time to spread the word and help those in need. Yes, you need this in your life.
Where Can I Find This Feature?
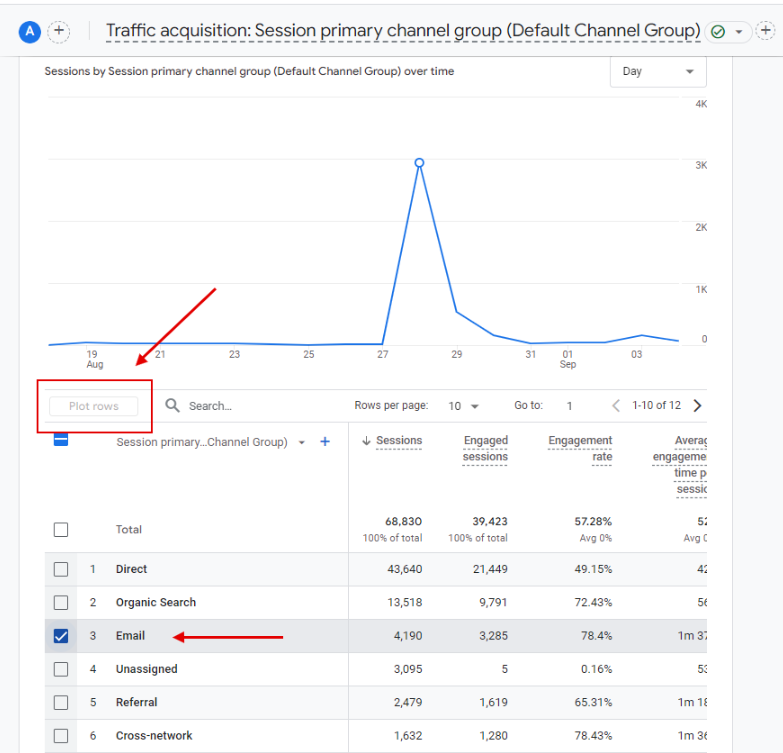
Plot Rows should now be available in most reports under the “Reports” section.
You should be able to plot up to 5 rows by just selecting the check-box and clicking “Plot rows”.
We know. It’s such a small feature, but a huge time saver and very useful for exploring insights.
Enjoy!