

Did They Actually Read It? Measuring Article Read-Through in GA4
(The original article in Japanese was written by Kasumi Yoshinari, Senior Customer Success Consultant at Ayudante. This article was translated by Masaki Kuroshima.)
You turned on GA4 scroll tracking a while back. But have you actually done anything with the data?
In this article, we’ll use GA4’s default scroll event, plus a customized version of it, to show concrete ways to put read-through data to work. We won’t walk through every setup step here. Think of this as a starting point for picturing what’s possible.
Heatmap Tools vs. GA4: Which Should You Use?
Heatmap tools are the go-to option for seeing how users engage with your content.
Since GA4 can also track scrolls and clicks, we often hear, “Can GA4 replace our heatmap tool?” Our take: each has its own strengths, so use them for different jobs.
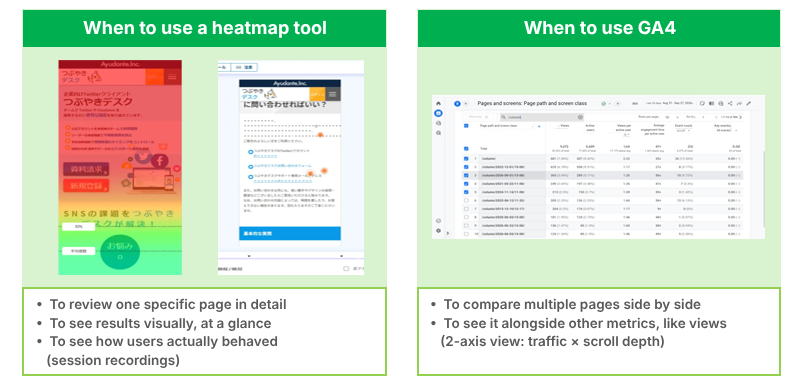
Heatmap tools are built specifically for analyzing scroll depth and on-page behavior. The results are easy to read at a glance, and some tools even offer session recordings so you can watch what real users do.
That makes them the better choice for evaluating entry pages, such as landing pages and your homepage.
On the other hand, heatmap tools show you one page at a time. For blogs and media sites with a large volume of content, reviewing every page individually isn’t realistic.
If you want to compare many pieces side by side (for example, “Which of last month’s posts got read the most?”), GA4 is often the faster way to get a quick answer.
GA4 is also handy if you just want a baseline before investing in a heatmap tool. You can start with the GA4 setup you already have.
Our recommendation: choose the tool based on the type of content you’re evaluating and the metrics you care about.
The Basics: Seeing How Far Users Scroll in GA4
GA4 has a built-in scroll event that you can turn on with a single toggle in the Admin settings.
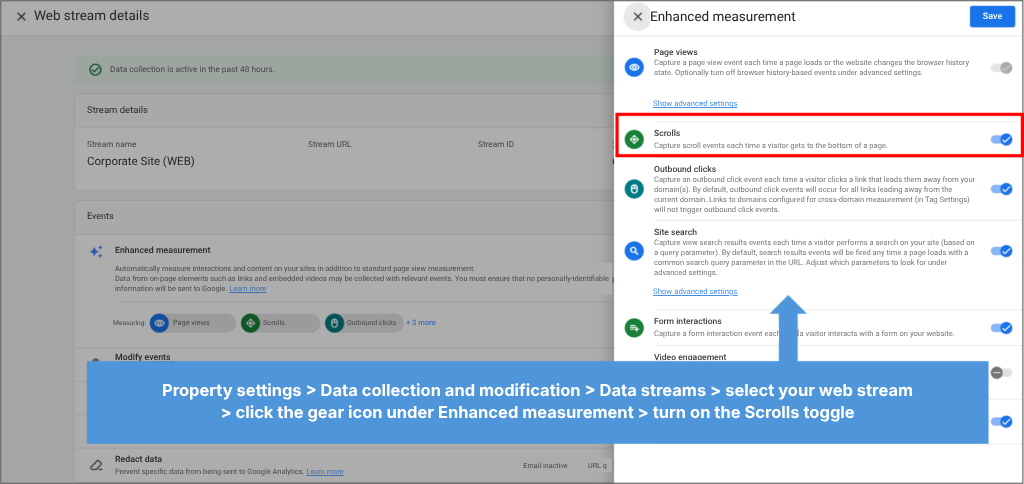
The scroll event fires automatically when a user scrolls to 90% of the page’s total height. Page details (Page location, Page path, etc.) and traffic source information are attached automatically, so you can run a basic read-through analysis without any extra setup.
Let’s use a standard report to look at read-through trends by page. Open the Pages and screens report and adjust it as needed:
- To focus on specific pages, use the search box or a filter
- Check Views to make sure the page gets enough traffic (if Views are low, people aren’t reaching the page in the first place)
- Set the Event count dropdown to “scroll” to see how many times users reached 90% (if this is low, people aren’t reading to the bottom)
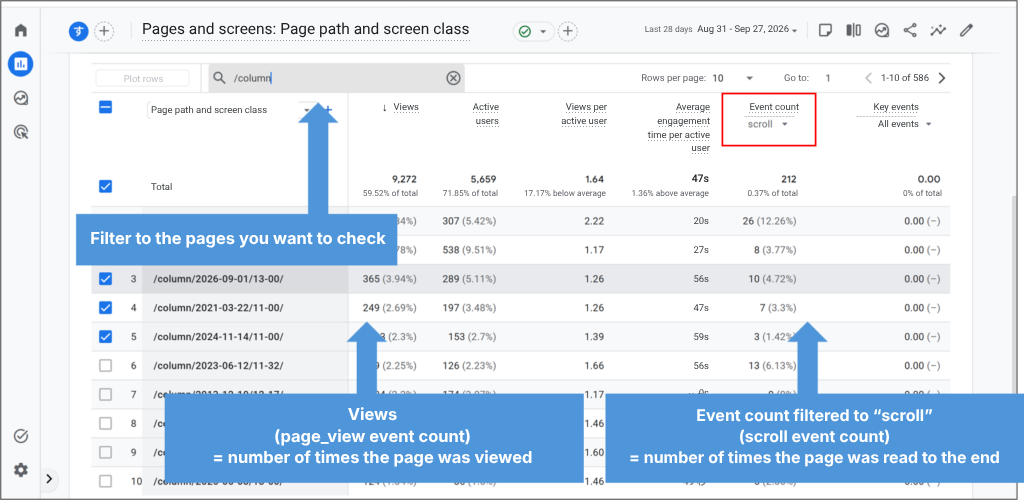
Laying the data out in a table helps you decide what each piece of content needs:
- Low Views but high scroll events: the content holds attention, so focus on driving more traffic to it
- High Views but low scroll events: people are landing but not reading, so focus on improving the content itself
So far, we’ve covered what you can do with GA4’s standard features alone. You can get surprisingly far without touching GTM or building Explorations, so this is a great place to start.
Going Further: What Does “Read” Mean for Your Content?
Does 90% Really Mean “Read” on Your Site?
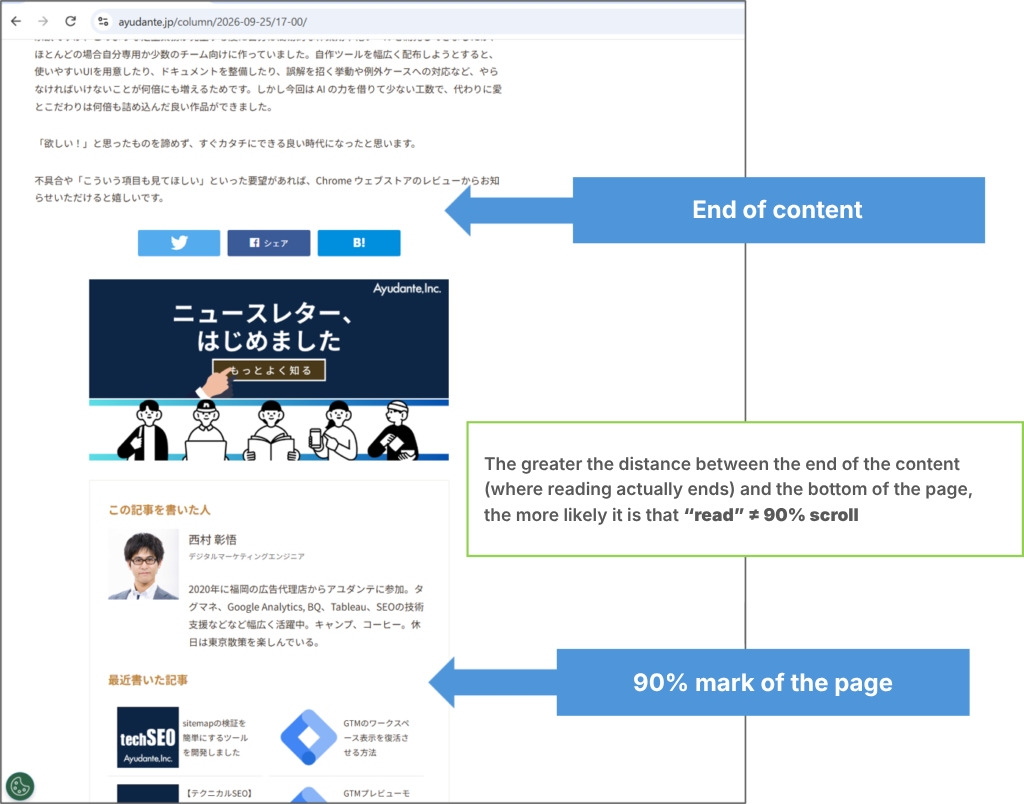
The scroll event fires at 90%, but that 90% isn’t always an accurate signal that someone read your content to the end.
If your site has a large footer, or sections below the content such as CTAs or recommended articles, the 90% threshold may not line up with where your content actually ends.
This is especially common on mobile. When a responsive layout stacks a lot of elements at the bottom of the page, the 90% mark can drift well away from the end of the content.
The opposite problem happens on short pages. If a page isn’t tall enough to scroll, the scroll event fires the moment the page loads.
For short pages that fit on a single screen, such as forms or brief announcements, you can’t treat 90% as “read,” and the scroll event isn’t useful.
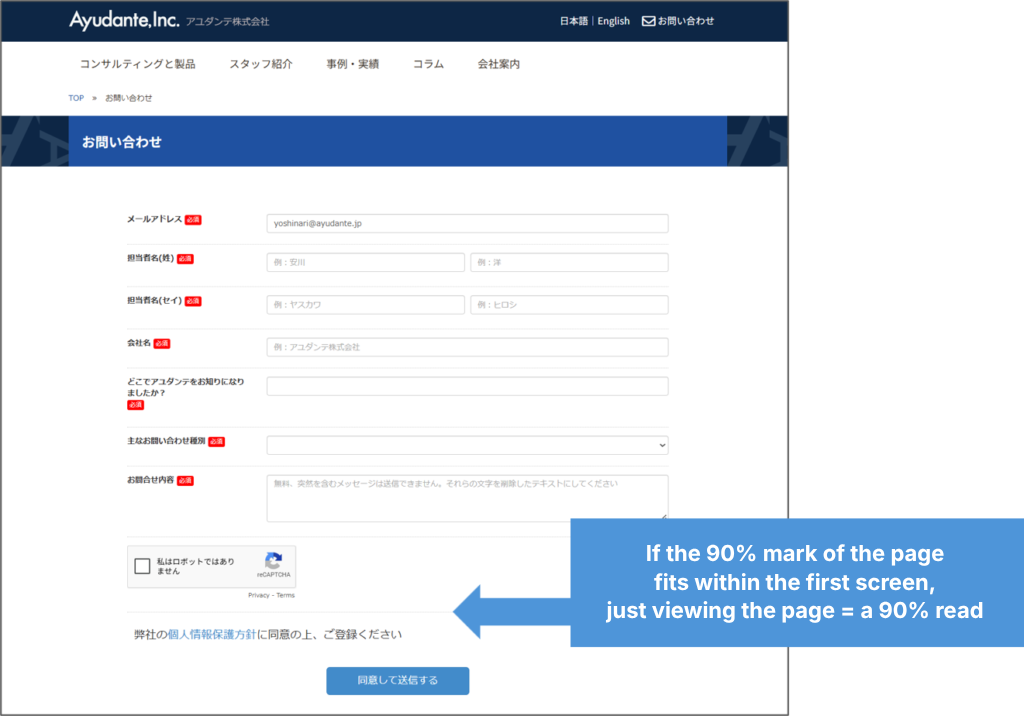
The 90% threshold is simply a mechanical, out-of-the-box benchmark that GA4 provides. If you want to define “read” precisely based on your site’s structure, you’ll need a custom setup.
Is 90% a “Fair” Read-Through Rate?
A read-through rate based on a single benchmark (“scrolled to the bottom”) is also skewed by content length.
Finishing a 50-word post is a very different ask from finishing a 5,000-word post. If you only use the 90% threshold, the only thing you’re measuring is “finished or not,” and you end up with obvious conclusions like “longer content gets finished less often.”
Accounting for content length is tricky, but at a minimum, it’s worth capturing more detail on how far users scroll than a single 90% mark.
A common approach is to fire scroll events at finer intervals, such as every 15% or every 10%.
The right interval depends on your site structure, but we’d suggest not going too granular. With 10% intervals, a single swipe can fire several events at once, which can actually make the data harder to use.
(Keep in mind that these events only tell you a user saw a given portion of the page, not that they actually read it.)
Another option, and our personal favorite, is to track when specific page elements come into view.
For example, if you track each heading (<h2> tag), you can see things like “the user reached the second heading but left before the fourth one appeared.”
For blogs in particular, “users read through section 2 but dropped off before section 3” is far more actionable than “users drop off between 25% and 50%.”
This approach requires GTM configuration and Explorations, so there’s a bit of a learning curve. But if you want scroll tracking that’s genuinely easier to use, we recommend it.
One caveat: the more granular your tracking, the more events you’ll collect, since event volume grows with every scroll milestone a user hits.
Going Further: How Your Read-Through Reports Change
Here’s what your reports can look like once you’ve customized your tracking as described above. Whether you track by percentage or by heading, the output looks roughly the same.
Note: All data shown is dummy data.
Checking Read-Through Rates
First, let’s look at Views and how far users scrolled for each page, all in one table.
A common approach is to store scroll depth in a custom dimension, but that makes it hard to place it alongside metrics like Views in the same table. It takes a bit more setup, but registering scroll milestones as custom metrics lets you compare everything side by side, which is why we prefer it.
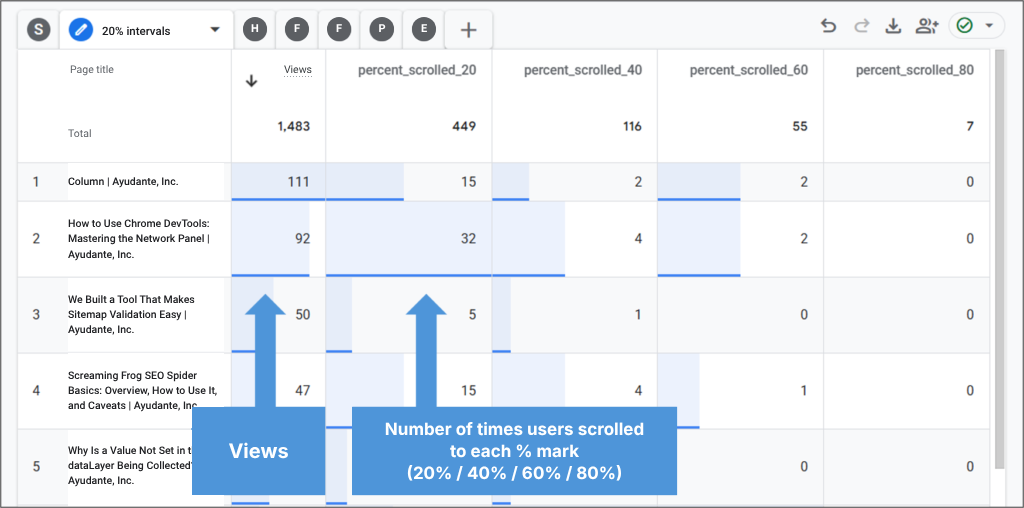
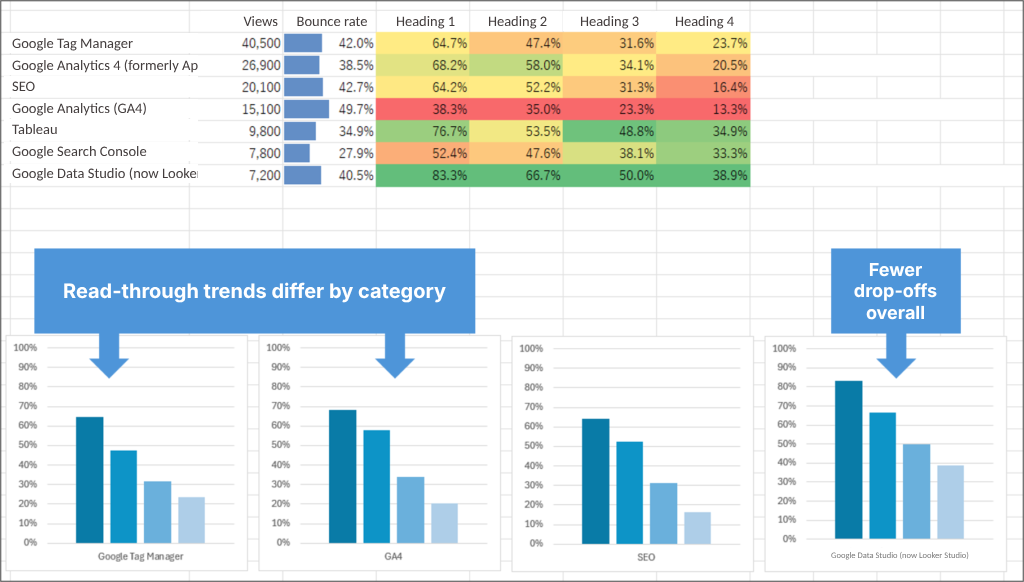
It would be nice if GA4 calculated the percentages for you, but calculated metrics don’t support a percentage format. To calculate scroll rate against views, export the data to Excel or Google Sheets, or use Looker Studio.
If you’ve set up content groups, you can also roll the data up beyond individual articles, for example, by article category.
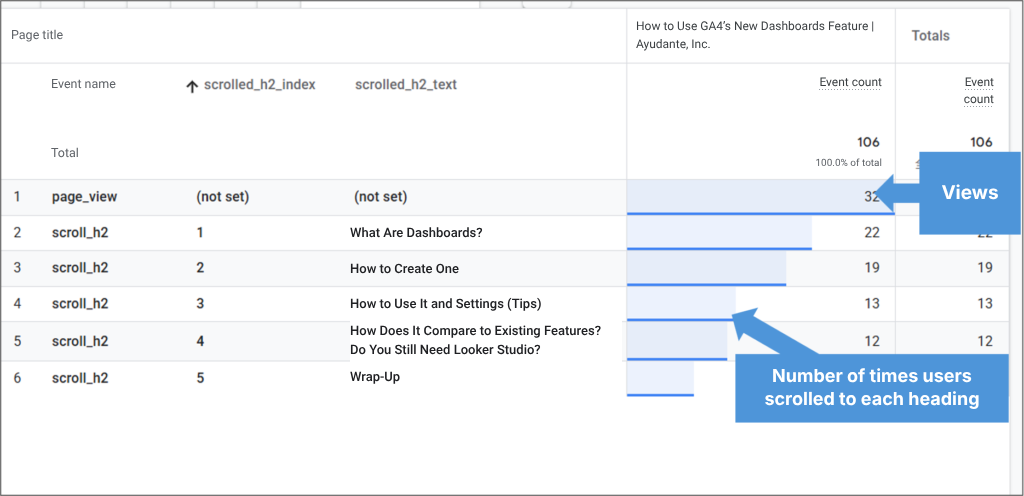
To zoom in on a single page, capture the heading number and heading text. Your report will look something like this:
It’s much easier to see how far people read than to flip between the live page and GA4 wondering, “Where exactly is 60%?”
Use Segments to See What Your Readers Look at Next
Scroll rates are useful, but it’s even better to understand who the people reading your article are. Let’s build a segment of users who scrolled to a specific point in a specific article and see what else they viewed.
We’ll use a Path exploration to see how these users moved through the site after arriving.
A Path exploration starts from a condition you set and follows user behavior step by step: “What page did they view next? And after that?”
The order varied, but most users seemed to be working through our newest articles one after another.
These are likely returning readers of our blog who drop by to catch up on new posts.
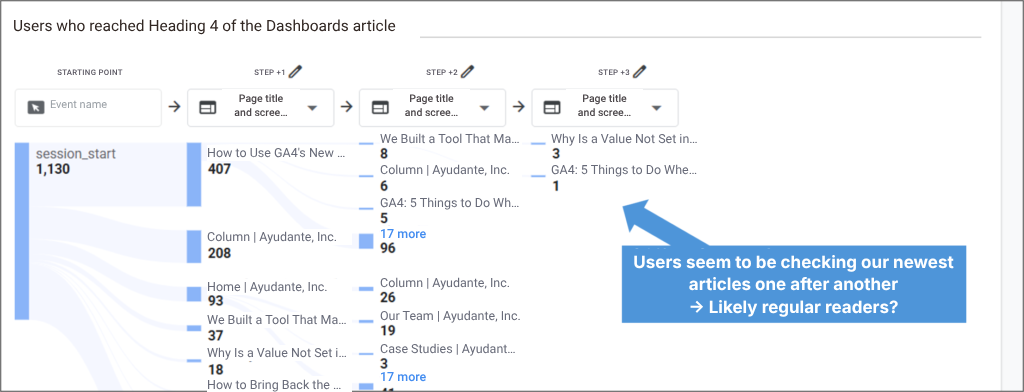
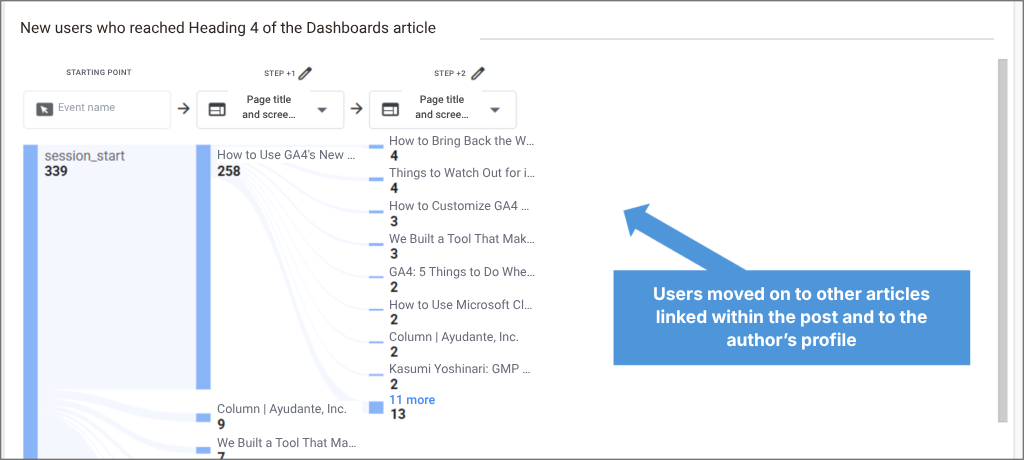
To separate out these regulars, we changed the segment condition to “users who reached Heading 4 of the article during their first session.”
Earlier, users moved on to other recently published articles. New users behaved differently. They clicked through to older articles linked from the post, related older content, and the author’s profile.
It looks like they were doing the kind of vetting that’s typical of a first visit: “Can I trust this site? Is there anything else here that’s useful to me?”
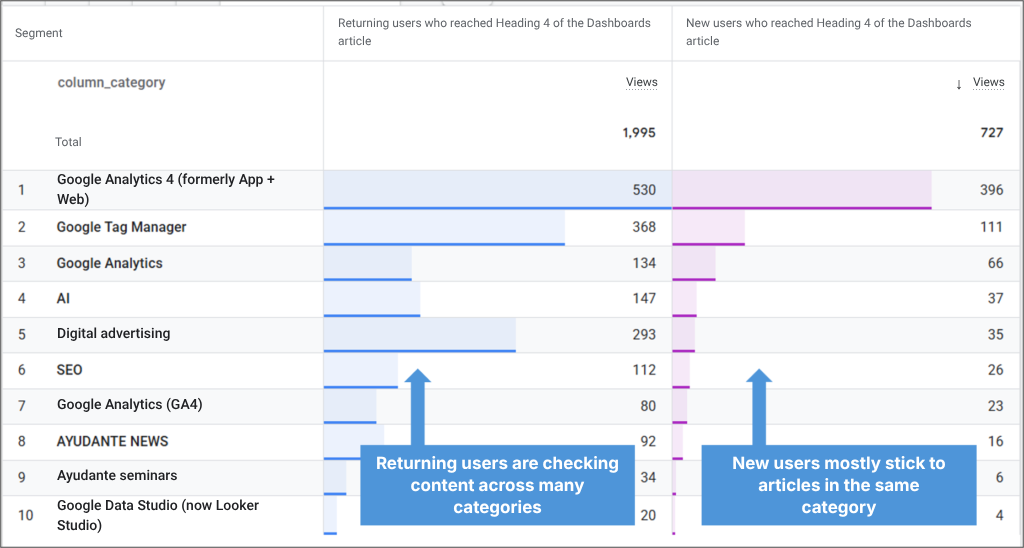
One limitation of Path exploration is that it treats “A → B → C” and “A → C → B” as different paths. The number of variations grows quickly, which makes it less suited to open-ended exploration. So let’s simplify: regardless of order, what other articles did people who finished this article view?
Since new users seemed to behave differently, we also added a New / Returning breakdown based on whether the user finished the article in a new or returning session.
Returning users viewed a wide range of articles outside this article’s category. That matches the “working through new posts” pattern we saw earlier.
You could keep slicing and drilling down from here, but we’ll stop here for now.
Wrap-Up
We’re curious to see how far down this article people will scroll. How many of you made it all the way to this last heading?
Plenty of teams turn on scroll tracking just in case. But “lots of people scrolled” on its own isn’t an insight. Without a clear purpose, it’s just data that never gets used.
If you’re going to track scrolling, take the time to make sure it produces data that actually helps you improve your articles and pages.
We hope this article helps.